AI agents for Accounts Payable and Procurement. They read every invoice, validate tariffs against published rates, flag billing errors and close the fiscal cycle — before anything enters your ERP. Start with one workflow. Expand across finance.
Utilities & EnergyRetail multi-siteCorporate real estate
18% · avg overcharge detected month 1
RegulatedOverchargeRecovered
Your finance team, multiplied
Agents that work for your team — even when nobody's looking
A family of specialized agents covering the full Finance Ops cycle: they read invoices, run 3-way matching, audit regulated tariffs, calculate withholdings, hunt duplicates and keep fiscal compliance current — quietly, in the background, 24/7. Your team's hours go back to strategy, not data entry.
Agents in production95%+ audited accuracyLive in ~1 month
Live
Agent 01 · CAPTURE
Multi-source capture
Reads any invoice — PDF, photo, scan, XML or EDI. Zero templates, zero manual rules. Your team stops typing data into the ERP.
Connects to email, portals, Drive and SharePoint
Assigns cost center and accounting code on its own
Routes approvals based on your org chart
95%+Audited accuracy
Live
Agent 02 · VALIDATION
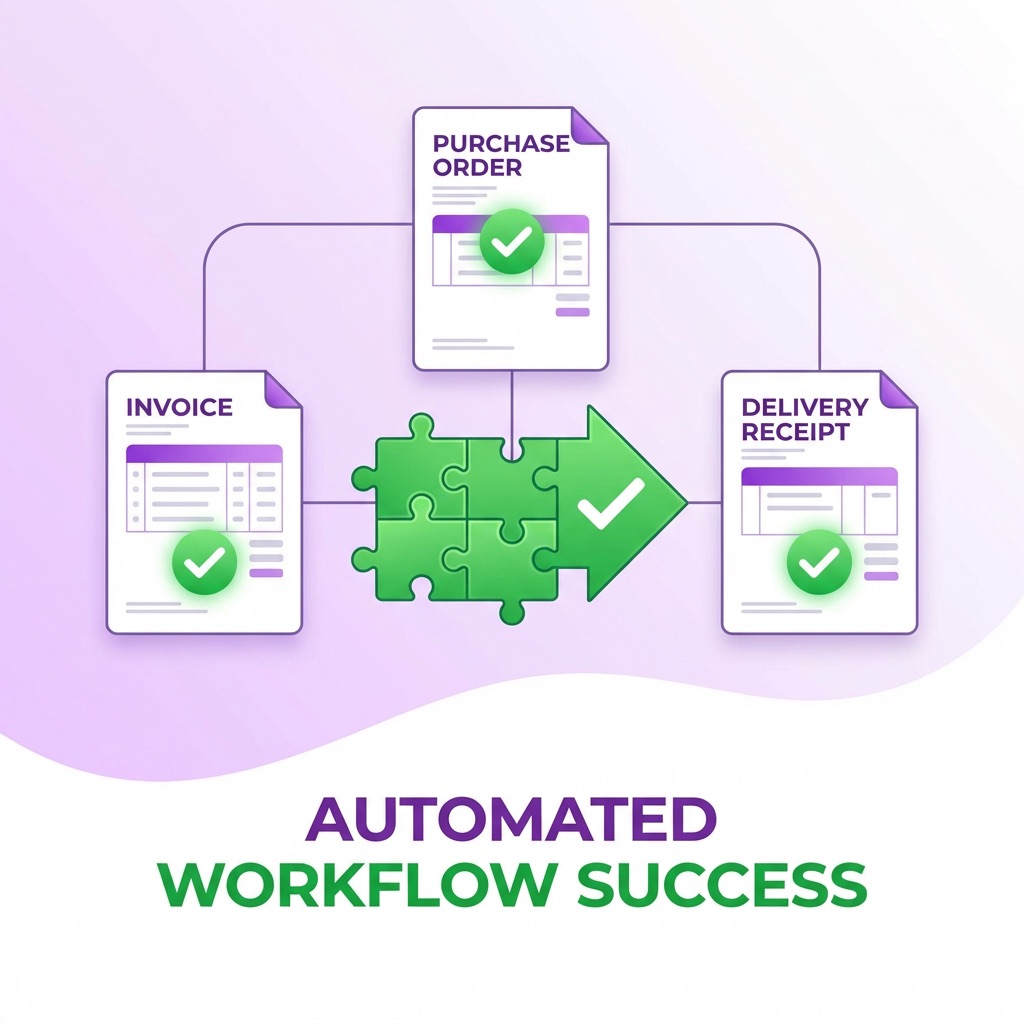
3-way matching
Matches invoice, purchase order and receipt line by line. Catches duplicates, overcharges and errors before you pay — and before they hit your ERP.
Configurable tolerances per supplier
Blocks duplicate payments automatically
Syncs with SAP, NetSuite and Oracle
100%Full AP cycle coverage
Live
Agent 03 · TARIFF
Tariff validation
Audits every electricity, gas and water bill against the official tariffs. Finds the overcharges your team never has time to look for.
Cross-checks official tariffs in real time
Claim reports ready to send
Tracks recovery to the last dollar
USD 45KRecovered per client
Live
Agent 04 · UTILITIES
Multi-site consolidation
Real-time visibility on electricity, gas and water usage across every site. Catches consumption spikes before costs balloon and keeps ESG reporting ready when the board asks.
Automated multi-site consolidation
Alerts on unusual consumption
ESG reports ready when the board asks
500+Branches monitored
Live
Agent 05 · COMPLIANCE
LATAM fiscal compliance
CFDI 4.0, NF-e, SII, AFIP, DIAN, SUNAT — always current. Operate across 6 countries without a tax specialist in each one, and without nasty surprises from the regulator.
Regulatory changes applied on their own
Correct withholdings per jurisdiction
Audit trail ready for your accountant
6 countriesCompliance kept current
Live
Agent 06 · BOOKKEEPING
Accounting coding
Assigns cost center, accounting code, tax code and project on every invoice. Learns from your corrections — gets it right next time.
Chart of accounts mirrored from your ERP
VAT, sales tax and withholding per jurisdiction
Learns from every correction your team makes
90%Right on the first pass
Live
Agent 07 · APPROVAL
Approval workflows
Routes every invoice through the right flow: amount, department, supplier, urgency. Your managers approve from their phone in seconds.
Multi-level rules without writing code
Mobile and email approvals
Auto-escalation when SLAs slip
70%Less approval time
Live
Agent 08 · WITHHOLDING
Withholding tax calculation
Calculates and validates every income tax, VAT and local withholding on supplier invoices. Zero surprises at quarter close.
Rules updated per province and tax regime
Catches missing withholdings on incoming invoices
Certificates and reports ready for the tax authority
100%Withholdings applied
Live
Agent 09 · DUPLICATES
Duplicate detection
Scans your payment history and finds the duplicates that slipped through. You claim them back from suppliers — real money recovered.
Sweeps the last 24 months of payments
Catches duplicates even with different invoice numbers
One-click supplier claim workflow
2-3%Of historical payments
Live
Agent 10 · DETECTION
Anomaly detection
Sniffs out fraud, off-pattern invoices and suspicious suppliers before money ever leaves your account.
ML trained on your historical data
Per-invoice risk scoring
Supplier screening against sanctions lists
99.5%Fraud detection accuracy
From your AI of choice
And your team can ask Claude or Gemini about their invoices
Your finance data no longer lives only inside Cedalio. Your team can ask about a payment status, the month-end close or upcoming due dates straight from Claude, Gemini or any AI assistant they already use — no extra window, no waiting for the analyst with the spreadsheet.
Claude
Connected
Gemini
Connected
Your assistant
Via API
Want to see the agents running on your real invoices?
Not ready to book a demo? Get a free audit of your invoices.
Send us a sample of up to 50 invoices (utilities, vendors, whatever hurts most). Within 48 hours, we'll send back a report with detected overcharges, duplicates and annual savings potential — without you having to talk to anyone.
Overcharges vs. regulated tariffs
Duplicates, double payments and anomalies
Annual savings potential quantified in USD
Request free audit
NDA available · Files deleted after the report · GDPR compliant
Audit report48h
Overcharges detectedUSD 12,400
Duplicates3 invoices
Tariff anomalies7 cases
Annual savings potentialUSD 148K
Ready to automate your financial operations?
30-minute demo, no commitment. We look at your case and show you how much you'll save.
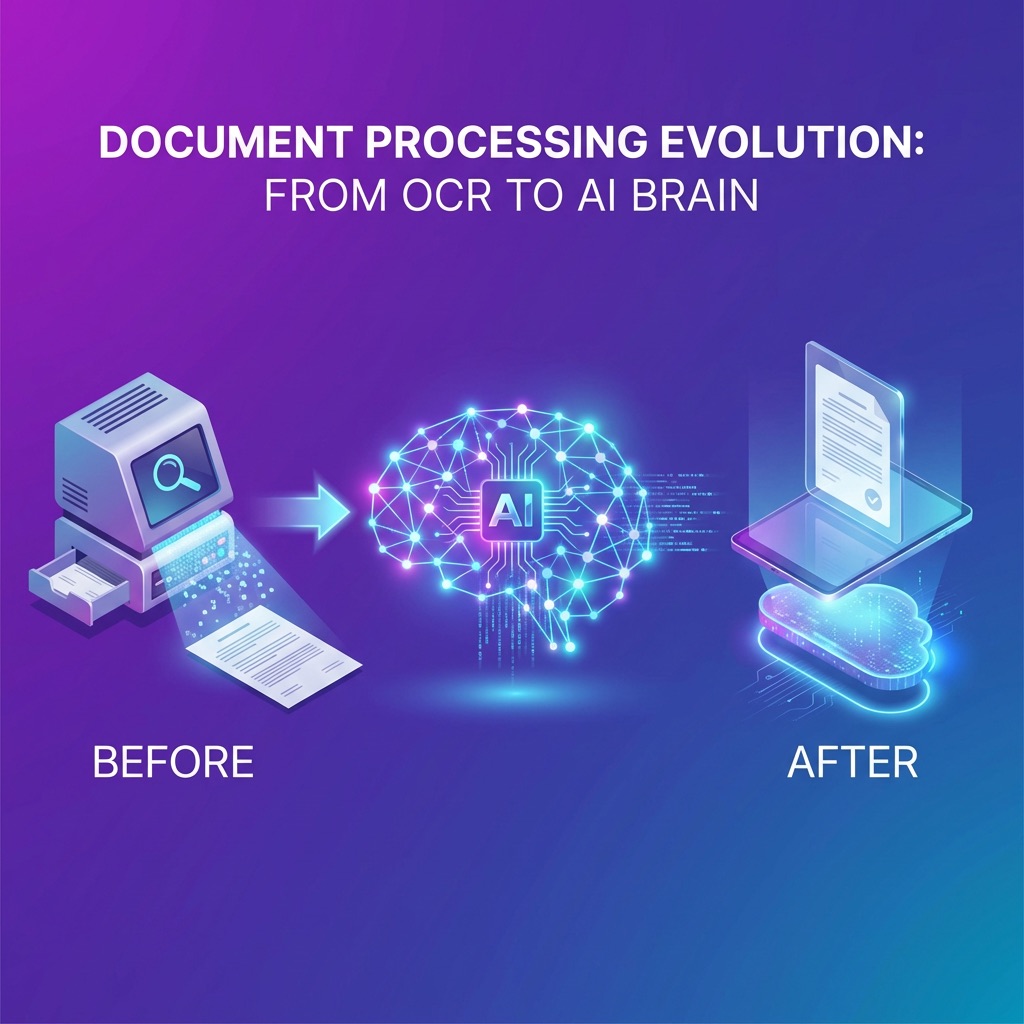
Cedalio doesn't use OCR. We use specialized AI agents with vision models that understand the context of each financial document — they don't just extract text, they interpret invoices, purchase orders, receipts and contracts to structure the data automatically. We process PDFs, images, scans, mobile photos and electronic documents (XML, EDI). The agents learn from your team's corrections and keep improving.
How is Cedalio different from traditional OCR?
Traditional OCR only recognizes text in images. Cedalio goes much further: our AI agents understand the document's context, identify the type of invoice, extract specific fields (vendor, amount, due date, line items), validate against your ERP, execute business rules, and automatically trigger approval workflows. It's the difference between reading text and automating the entire accounts payable process.
What is the accuracy of data extraction?
Cedalio achieves 99% accuracy in data extraction thanks to multiple validation layers: vision AI agents read every field, master data validation, mathematical verification, and cross-referencing with purchase orders and receipts. Key fields like tax IDs, amounts, dates and line items are automatically validated. The system also learns from every manual correction to keep improving.
What insights and reports does Cedalio generate?
Cedalio generates actionable insights in real-time: spending analysis by vendor, category, and cost center; anomaly and duplicate detection; cash flow projections; expiration alerts; utility consumption comparisons by period and branch; and team productivity dashboards. All reports are exportable and can be scheduled for automatic delivery.
How secure is the platform?
Security is our priority. We are aligned to SOC 2 and in the certification process. All data is encrypted in transit and at rest. We offer Single Sign-On (SSO), two-factor authentication (2FA), granular role-based access control, complete audit logs, and the option for on-premise or private cloud deployment for Enterprise customers.
How does it integrate with my current ERP?
We have connections with major ERPs like SAP, Oracle, NetSuite, Microsoft Dynamics, TOTVS, and Odoo. If your ERP is not on the list, we offer bulk CSV upload and download for quick and frictionless integration. We also have a complete REST API and webhooks for custom integrations.
How long does it take to implement Cedalio?
Typical implementation takes 1-2 weeks for mid-sized companies and 2-4 weeks for enterprise with complex integrations. We include assisted onboarding, historical data migration, team training, and dedicated support during go-live. Our Customer Success team guides you through the entire process at no additional cost.
What tax validations does Cedalio perform?
Cedalio performs automatic validations against local tax authorities (tax IDs, withholding certificates, invoice authenticity), duplicate and anomaly detection, purchase order matching, and rate verification against public tariffs. All in real-time without manual intervention.
What results have other clients achieved?
Our clients achieve 90%+ reduction in AP team workload, detection of thousands of dollars in anomalies and incorrect charges, identification of penalties and billing errors, and savings of several minutes per invoice in manual controls. Typical ROI is seen in less than 3 months.
What's the minimum volume to use Cedalio?
With 1,000+ monthly invoices, Cedalio already makes sense. With 5,000+ invoices, it's a no-brainer due to time savings and error detection. It also applies to companies with multiple locations (200-300+ branches) even if per-location volume is lower.
Does Cedalio use my data to train AI models?
No. Your invoices and financial data are never used to train models for other customers, and data from one customer's instance is never shared with another. The model providers we work with are contractually barred from training on your data. When agents "learn from your corrections," that learning stays inside your own workspace.
Which AI models power the agents?
We use frontier vision and language models from providers such as Anthropic, OpenAI and Google (via GCP), accessed through enterprise APIs with zero data retention, and orchestrated by Cedalio's own validation and business-rules layer. Model choices evolve as the state of the art moves — what stays constant is that accuracy is audited continuously against your real documents.
Can the AI make mistakes?
Yes — no AI is infallible, and we won't tell you otherwise. That's exactly why every extraction passes through multiple validation layers (master data, mathematical checks, PO cross-referencing), why anything below a confidence threshold is routed to a human for review, and why every action is logged. Audited accuracy runs at 99%, and when something does slip, the audit trail shows you exactly where to look.
Do agents respect my team's roles and permissions?
Yes. Agents operate within the same role-based access control as your users — an agent working for a user can only see and do what that user could. Approval chains and segregation of duties are enforced by the platform, never bypassed by automation.
Blog & Resources
Featured articles
Guides and best practices to optimize your financial operations.
Complete Guide
Accounts Payable Automation: The Complete Guide 2026
Everything you need to know about AP Automation: benefits, implementation, ROI and best practices for companies in LATAM.